What is Pulse Volume Recording?
Pulse Volume Recording (PVR) is a pneumo-plethysmography test that is widely used for non-invasive diagnosis of lower extremity peripheral arterial disease (PAD).
Pulse Volume Recording is an air plethysmography waveform analysis test used to detect the segmental volume changes in the limb resulting from the flowing blood as a function of the cardiac cycle. This test is usually performed with a PVR machine.
How to Perform PVR Measurements
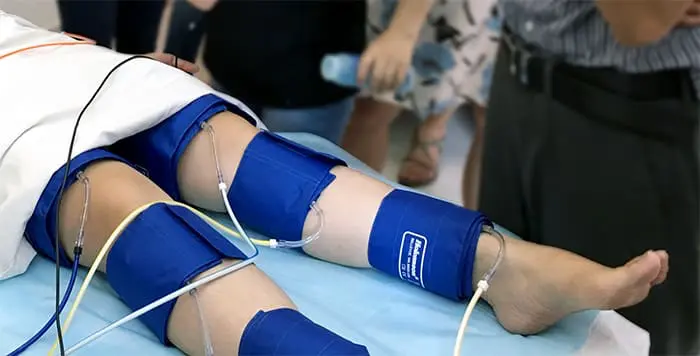
A pulse volume recording equipment is required for this test. With pulse volume recording, similar to the Segmental Blood Pressure (SBP) measurements, dedicated pressure cuffs are wrapped around the target limb segments prior to initiating the test. These sites typically include the thigh, above the knee, below the knee, and ankle on each leg. The cuffs are then inflated using a PVR machine to a pressure that would occlude the venous return yet will still maintain the arterial flow un-obstructed. This target pressure is typically 65 mmHg and is kept constant throughout the PVR measurement.
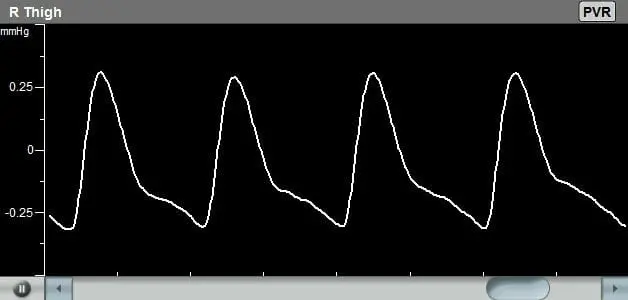
Once the cuff pressure is stabilized, the Pulse Volume Recording waveform is generated based on the pressure changes in the air inside the pressure cuff as the result of minute limb circumference changes. Thus, the elasticity or stiffness of the arterial circulation in the legs will determine, in part, the shape of the PVR waves. This test is mostly qualitative in nature, and the focus is on the shape of the PVR obtained waveforms.

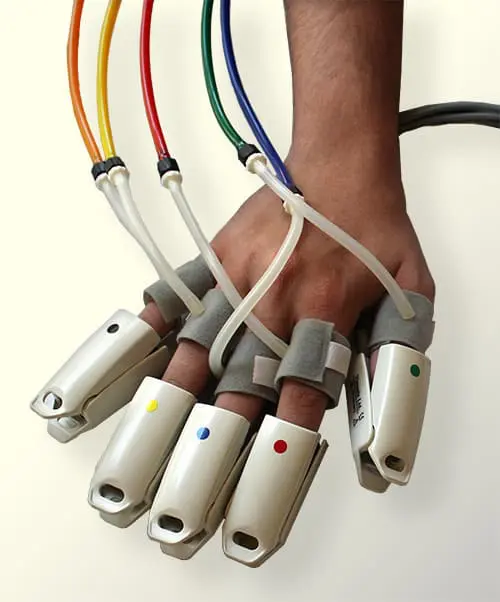
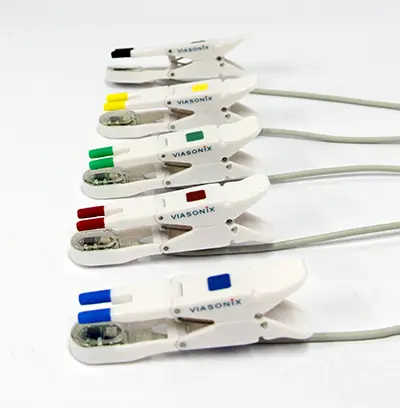
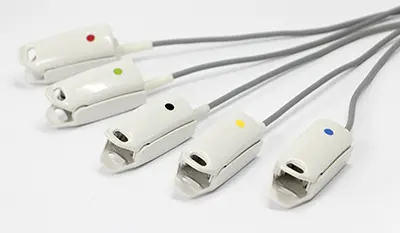
Inflatable Cuffs
High quality available in a variety of sizes
Using the Falcon for PVR measurements
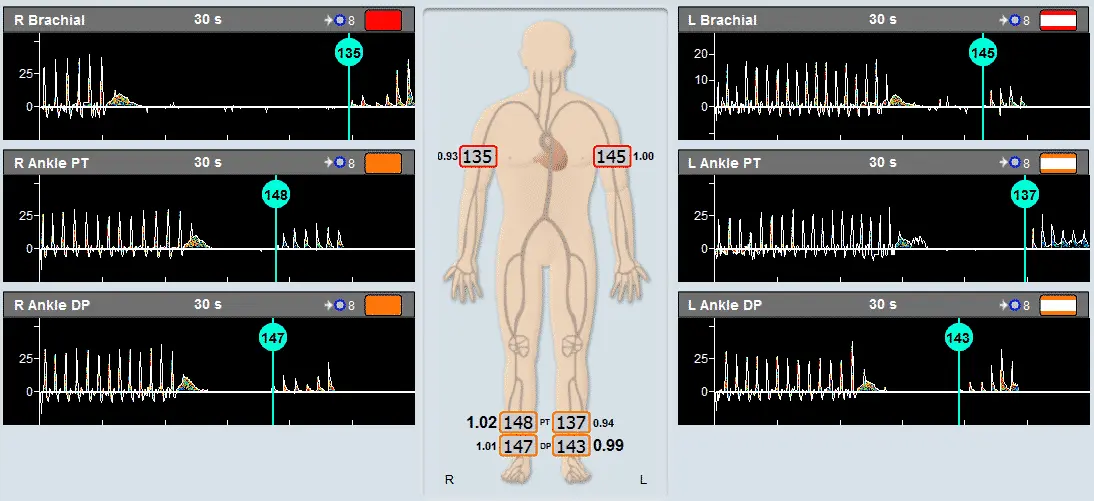
As a PVR machine, the Falcon allows immediate Pulse Volume Recording testing that can be completed very rapidly for each measured site. PVR measurements with the Falcon vascular diagnostic system can be performed either sequentially for one site after the other, bilaterally for simultaneous PVR measurements on similar right/left leg sites, or simultaneously on as many as 10 sites in parallel. The user is only required to place the color-coded pressure cuffs around each target site on both legs. Then, any PVR protocol needs to be selected. Now the test is ready to start and can be completed in just a couple of minutes.
All PVR settings can be pre-configured in the protocol, so only a single button can be used to complete the test. The user can modify the preferred target inflation pressure, sweep time display, scale, or filter.
Many other Falcon features and options, such as automatic simultaneous measurements or display of contralateral results, are designed to simplify the use of the Falcon PVR physiologic system followed by a complete clinical diagnosis in a fast and efficient way.
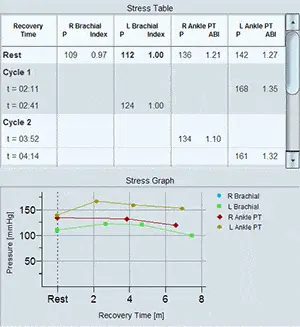
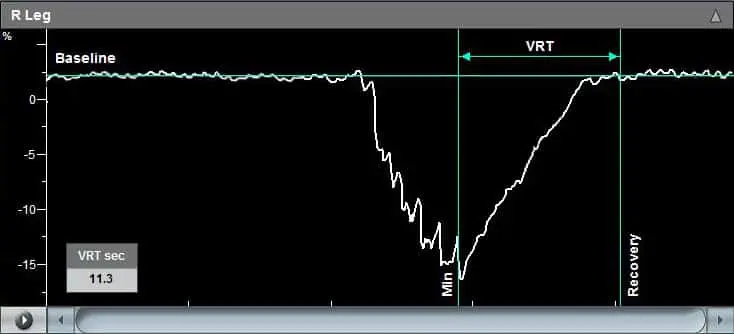
While the diagnosis of Pulse Volume Recording is primarily qualitative, the Falcon also provides a range of quantitative parameters, including the waveform amplitude, rise time, or heart rate. Additional calculations such as the RAR or waveform slope are also available.
Expected Results of Pulse Volume Recording Test
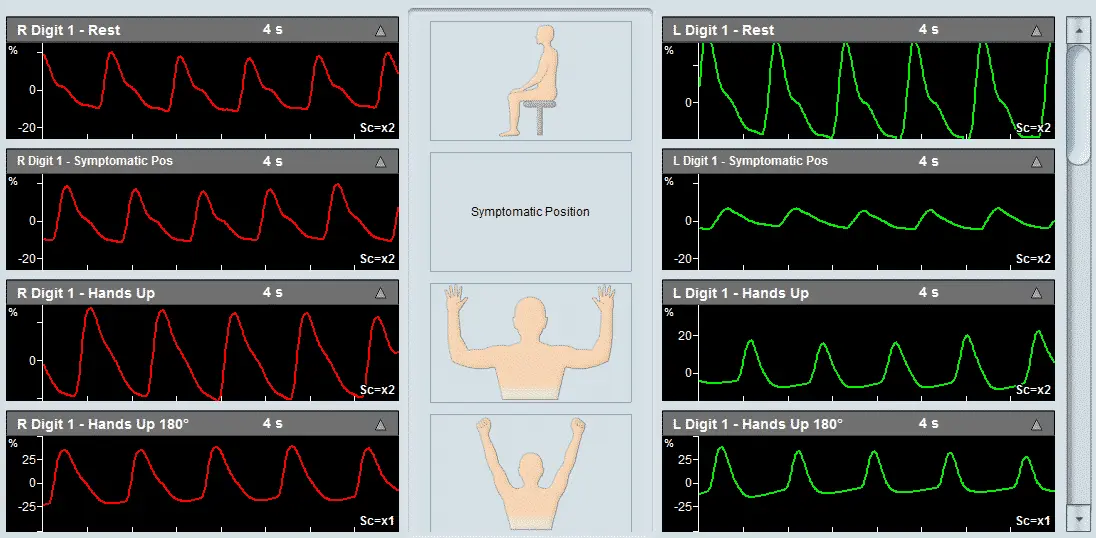
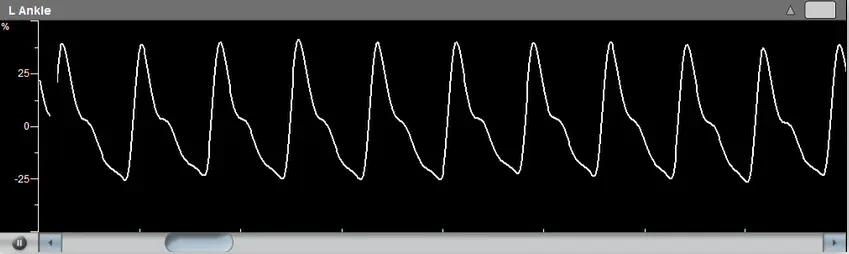
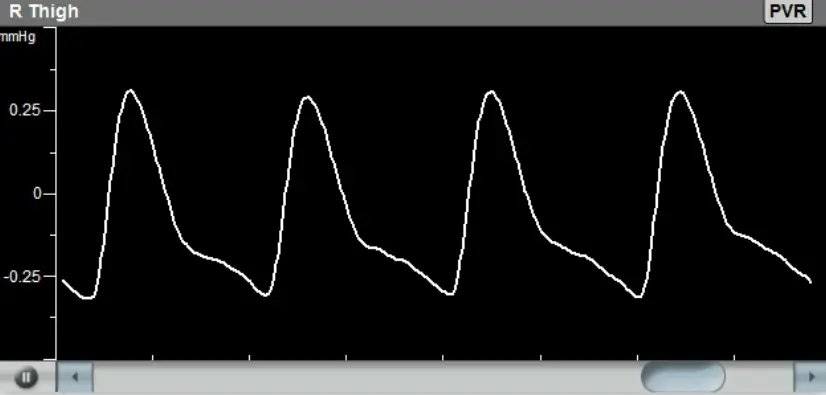
The diagnosis of the Pulse Volume Recording waveforms is mostly qualitative in nature. Clinicians are normally interested in the qualitative shape of the PVR waveform, specifically the systolic rise curve, the peak amplitude shape, the dicrotic notch during the downward section, and the diastolic section of the waveform. Typically, a “normal” PVR waveform consists of a rapid systolic upstroke, a relatively sharp peak, a downstroke with a prominent dicrotic notch, and clear diastole.
With increasing arterial disease, the PVR waveform becomes attenuated, the upstrokes and downstrokes are less prominent, the peak of the pulse volume waveform becomes rounded, the dicrotic notch in the waveform starts to disappear, and the waveform amplitude decreases and ultimately becomes flat. Additional quantitative parameters such as the absolute PVR amplitude or the relative amplitude reduction (RAR) and slope are discussed in the literature as possible additional quantitative diagnostic measures.